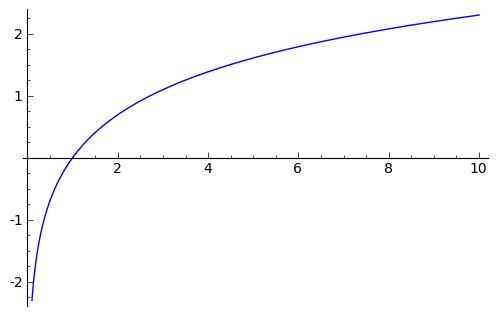
Plot of the continuous logarithm:
plot(log, 0.1, 10, rgbcolor = (0,0,1))
|
|
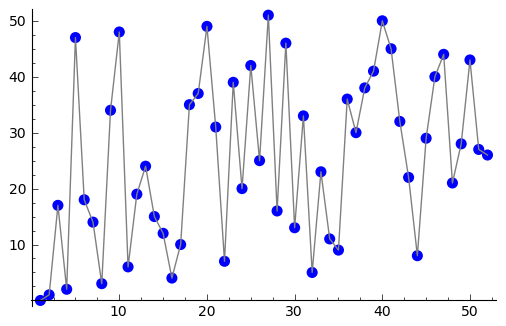
Plot of the discrete logarithm:
p = 53
R = Integers(p)
a = R.multiplicative_generator(); a
2 |
v = sorted([(a^n,n) for n in range(p-1)]); v
[(1, 0), (2, 1), (3, 17), (4, 2), (5, 47), (6, 18), (7, 14), (8, 3), (9, 34), (10, 48), (11, 6), (12, 19), (13, 24), (14, 15), (15, 12), (16, 4), (17, 10), (18, 35), (19, 37), (20, 49), (21, 31), (22, 7), (23, 39), (24, 20), (25, 42), (26, 25), (27, 51), (28, 16), (29, 46), (30, 13), (31, 33), (32, 5), (33, 23), (34, 11), (35, 9), (36, 36), (37, 30), (38, 38), (39, 41), (40, 50), (41, 45), (42, 32), (43, 22), (44, 8), (45, 29), (46, 40), (47, 44), (48, 21), (49, 28), (50, 43), (51, 27), (52, 26)] |
G = plot(point(v,pointsize=50, rgbcolor=(0,0,1)))
H = plot(line(v,rgbcolor=(0.5,0.5,0.5)))
G + H
|
|
|
|