Graphing Rational Functions
If ![]() is a rational function given by
is a rational function given by
![]() where
where
![]() and
and ![]() are polynomials, we can use the following information to
sketch the graph of
are polynomials, we can use the following information to
sketch the graph of ![]() :
:
I) Asymptotes
A) Vertical Asymptotes
To find the vertical asymptotes, we can first cancel any common
factors in ![]() and
and ![]() and then take the vertical lines corresponding to
the zeros of the denominator:
and then take the vertical lines corresponding to
the zeros of the denominator:
The line ![]() is a vertical asymptote for the graph of
is a vertical asymptote for the graph of ![]() whenever
whenever
![]() and
and ![]() .
.
The y-coordinates of points on the graph of ![]() get arbitrarily
large (in absolute value) as the graph approaches a vertical asymptote, and
get arbitrarily
large (in absolute value) as the graph approaches a vertical asymptote, and
the graph never crosses a vertical asymptote.
B) Horizontal Asymptotes
We can find the horizontal asymptotes by investigating the
behavior of ![]() as
as ![]() gets arbitrarily large (with either a plus sign or a
minus sign):
gets arbitrarily large (with either a plus sign or a
minus sign):
1. If
![]() , then the line
, then the line ![]() (the x-axis) is
the horizontal asymptote for the graph of
(the x-axis) is
the horizontal asymptote for the graph of ![]() .
.
2. If
![]() , and
, and ![]() and
and ![]() are the
coefficients of the highest powers of
are the
coefficients of the highest powers of ![]() appearing in
appearing in ![]() and
and ![]() ,
respectively, then the line
,
respectively, then the line ![]() is the horizontal asymptote for the graph of
is the horizontal asymptote for the graph of
![]() .
.
3. If
![]() , then there is no horizontal
asymptote for the graph of
, then there is no horizontal
asymptote for the graph of ![]() .
.
The graph of ![]() will approach the horizontal asymptote (when
there is one) as
will approach the horizontal asymptote (when
there is one) as ![]() gets arbitrarily large (with either a plus sign or a minus
sign).
gets arbitrarily large (with either a plus sign or a minus
sign).
To determine if the graph crosses a horizontal asymptote with equation ![]() ,
,
we need to solve the equation ![]() .
.
C) Slanted Asymptotes
If
![]() , then the graph of
, then the graph of ![]() has a slanted
asymptote; and we can find the slanted asymptote by dividing
has a slanted
asymptote; and we can find the slanted asymptote by dividing ![]() by
by ![]() :
:
If
To determine if the graph crosses a slanted asymptote, we need to solve
the equation ![]() or, equivalently, the equation
or, equivalently, the equation ![]() .
.
Notice that if ![]() is a rational function, then its graph cannot have
is a rational function, then its graph cannot have
a) two horizontal asymptotes or
b) both a horizontal asymptote and a slanted asymptote.
II) Intercepts
The intercepts correspond to the points where the graph intersects the two coordinate axes:
A) To find the y-intercept, set ![]() and solve for
and solve for ![]() ;
so the y-intercept is given by
;
so the y-intercept is given by ![]() .
.
B) To find the x-intercepts, set ![]() and solve for
and solve for ![]() ;
so the x-intercepts are the values of
;
so the x-intercepts are the values of ![]() for which
for which ![]() (and
(and ![]() ).
).
III) Sign Chart for ![]()
The sign of ![]() indicates where the graph is above or below the x-axis:
indicates where the graph is above or below the x-axis:
A) Where ![]() , the graph of
, the graph of ![]() is above the x-axis.
is above the x-axis.
B) Where ![]() , the graph of
, the graph of ![]() is below the x-axis.
is below the x-axis.
(In calculus, you will use sign charts for the first derivative
![]() and the second derivative
and the second derivative
![]() to get more
detailed information about the graph of
to get more
detailed information about the graph of ![]() .)
.)
Ex 1 If
![]() ,
,
find the asymptotes and intercepts for the graph of ![]() , and then use this
information and a sign chart for
, and then use this
information and a sign chart for ![]() to sketch the graph of
to sketch the graph of ![]() .
.
Sol 1) Since ![]() is a non-constant polynomial, there are no asymptotes for
its graph. (Here
is a non-constant polynomial, there are no asymptotes for
its graph. (Here
![]() and
and ![]() .)
.)
2) a) ![]() , so the y-intercept is -3.
, so the y-intercept is -3.
b) ![]() for
for ![]() ,
, ![]() , or
, or ![]() ;
so the x-intercepts are -1,1, and 3.
;
so the x-intercepts are -1,1, and 3.
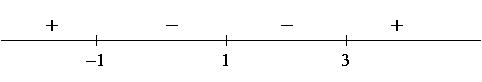
3) Using the facts that ![]() and that the sign of
and that the sign of ![]() changes at -1 and 3
and does not change at 1, we get the following sign chart for
changes at -1 and 3
and does not change at 1, we get the following sign chart for ![]() :
:
The following is a sketch of the graph of ![]() :
:
Ex 2 If
1) Find the asymptotes for the graph of ![]() .
.
2) Find the intercepts for the graph.
3) Make a sign chart for ![]() .
.
4) Determine if the graph of ![]() crosses its horizontal asymptote, and if the
graph has symmetry around the origin or the y-axis.
crosses its horizontal asymptote, and if the
graph has symmetry around the origin or the y-axis.
5) Use the above information to sketch the graph of ![]() .
.
Sol
1) a)
![]() , so
the vertical asymptotes are the lines
, so
the vertical asymptotes are the lines ![]() and
and ![]() .
.
b) Since ![]() and
and ![]() have the same degree, the horizontal asymptote is
the line
have the same degree, the horizontal asymptote is
the line ![]() .
.
2) a) ![]() , so the y-intercept is 2/9.
, so the y-intercept is 2/9.
b) ![]() for
for ![]() or
or ![]() , so the x-intercepts are -1 and 1.
, so the x-intercepts are -1 and 1.
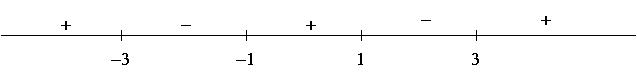
3) Using the facts that ![]() and all the exponents are odd, we get
the following sign chart for
and all the exponents are odd, we get
the following sign chart for ![]() :
:
4) a) Setting ![]() and solving gives
and solving gives
![]() , so
, so
![]() or
or ![]() . Therefore there is no solution, so the
graph of
. Therefore there is no solution, so the
graph of ![]() does not cross the horizontal asymptote.
does not cross the horizontal asymptote.
b) Since ![]() ,
, ![]() is an even function and therefore its graph is
symmetric around the y-axis.
is an even function and therefore its graph is
symmetric around the y-axis.
5) Using this information, we get the following graph:
Ex 3 If
1) Find the asymptotes for the graph of ![]() .
.
2) Find the intercepts for the graph.
3) Make a sign chart for ![]() .
.
4) Determine if the graph of ![]() crosses its horizontal asymptote, and if the
graph has symmetry around the origin or the y-axis.
crosses its horizontal asymptote, and if the
graph has symmetry around the origin or the y-axis.
5) Use the above information to sketch the graph of ![]() .
.
Sol
1) a) Since
![]() , the vertical asymptotes
are the lines
, the vertical asymptotes
are the lines ![]() and
and ![]() .
.
b)Since
![]() , the horizontal asymptote is the line
, the horizontal asymptote is the line ![]() (the x-axis).
(the x-axis).
2) a) ![]() , so the y-intercept is 0.
, so the y-intercept is 0.
b) ![]() when
when ![]() , so the x-intercept is 0.
, so the x-intercept is 0.
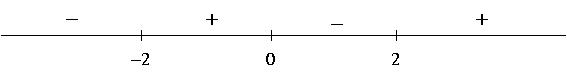
3) Using the facts that ![]() and that the exponents are all odd, we
get the following sign chart for
and that the exponents are all odd, we
get the following sign chart for ![]() :
:
4) a) Setting ![]() and solving gives
and solving gives ![]() , so the graph intersects the
horizontal asymptote at
, so the graph intersects the
horizontal asymptote at ![]() .
.
b) Since ![]() ,
, ![]() is an odd function and therefore its graph is
symmetric about the origin.
is an odd function and therefore its graph is
symmetric about the origin.
5) Using the above information, we get the following graph:
---------------------------------------
For each of the following functions,
1) Find the asymptotes for the graph of ![]() .
.
2) Find the intercepts for the graph.
3) Make a sign chart for ![]() .
.
4) Determine if the graph of ![]() crosses its horizontal asymptote or slanted
asymptote (if there is one), and if the graph has symmetry around the origin
or the y-axis.
crosses its horizontal asymptote or slanted
asymptote (if there is one), and if the graph has symmetry around the origin
or the y-axis.
5) Use the above information to sketch the graph of ![]() .
.
---------------------------------------
Pr 1
Pr 2
Pr 3
Pr 4
Pr 5
Pr 6
Pr 7
Pr 8
Pr 9
Pr 10
Pr 11
Pr 12